SQN MAX main page
Welcome to SQN MAX strategy main page!!
You will find in this page all information related to the SQN MAX strategy: origin, how to trade the strategy, choice of brokers, link to the EAs and indicators, etc...
This page is updated frequenly. Visit this page later again if you want to be updated.
SQN MAX results
Please find below results of our SqnMax strategy.
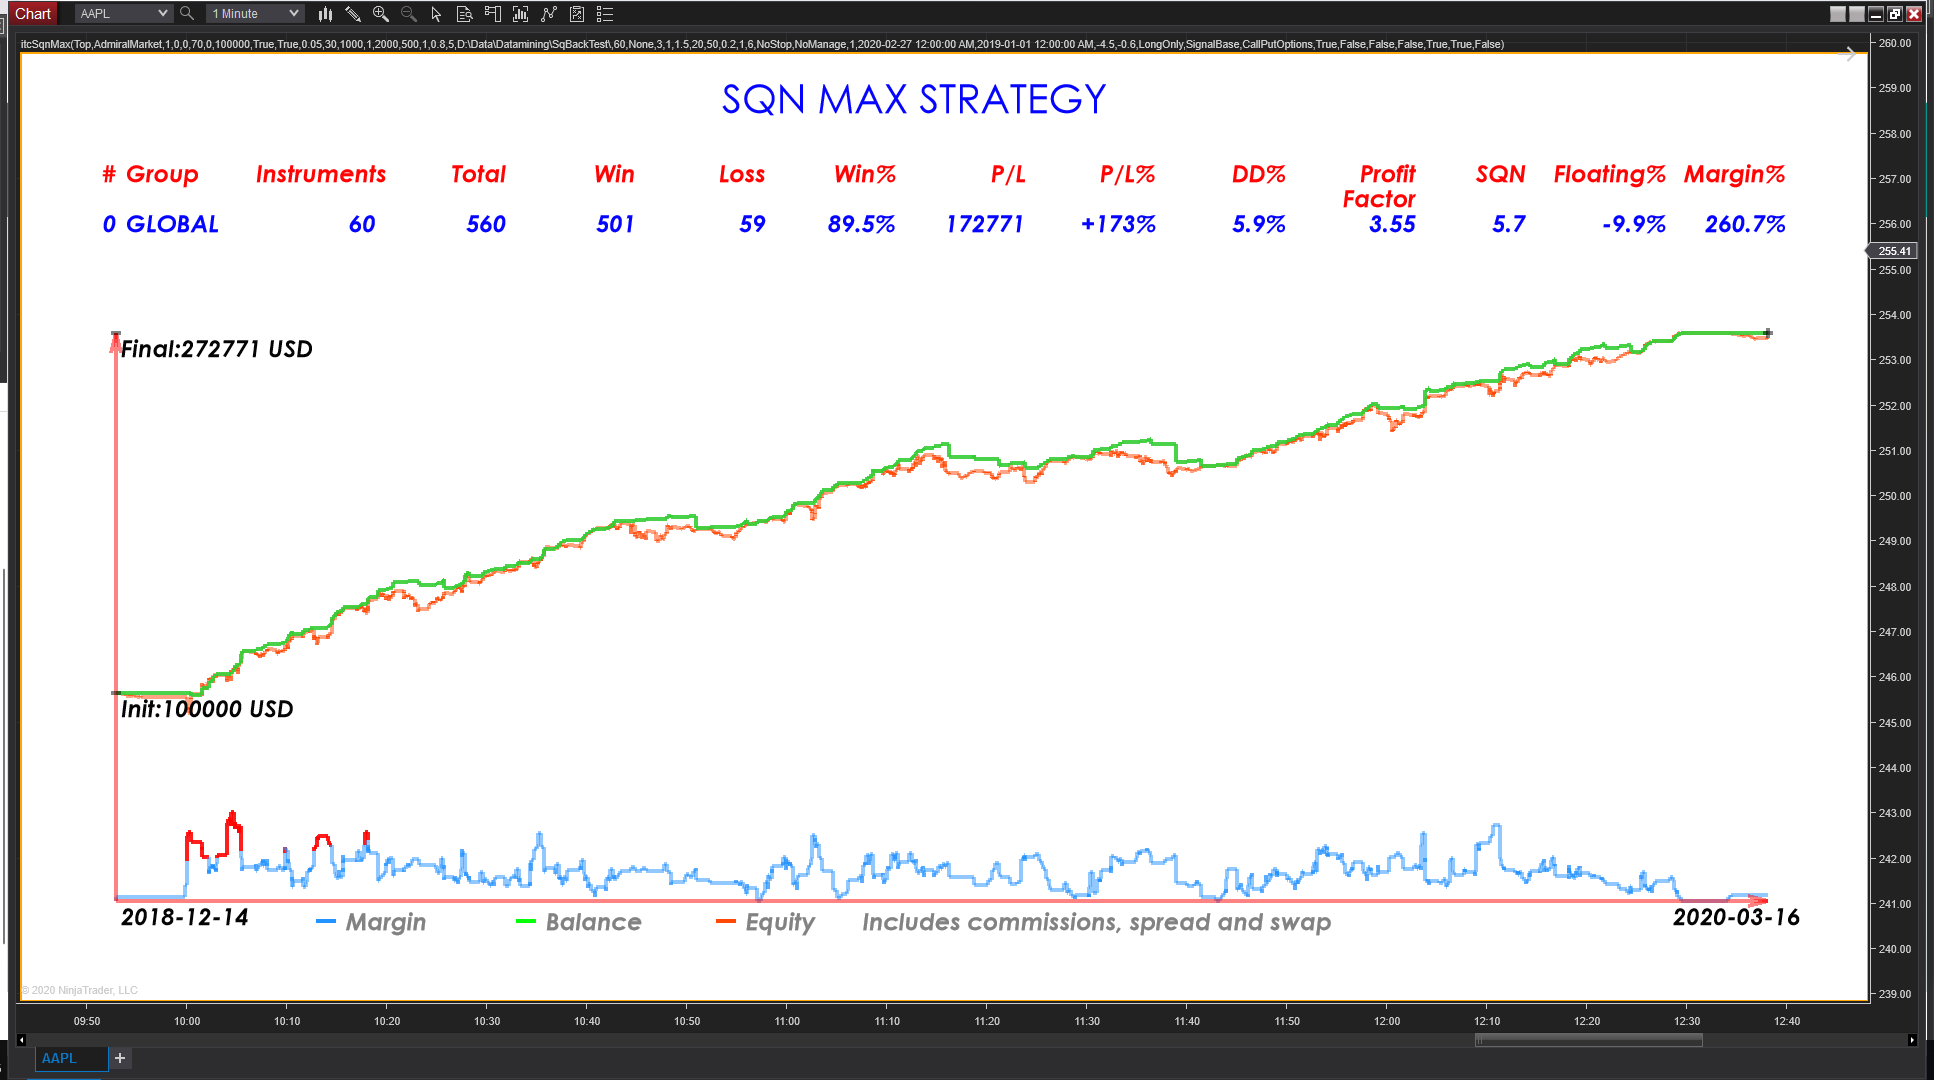
The chart below shows performance of the strategy for the year 2019 with a basket of 60 stocks from the American stock market (click the image to enlarge).
Beware that not following the documentation and our recommendations might result in deceiving experience. Take the time to read the Questions and Answers section below. Watch the video that we prepared as an introduction. We do not promise you any get rich quick scheme. We just share our experience with you and we give you facts that you can check by yourself. Then you have to make the decision if this trading strategy is for you or not.
As you can see the system produced more than 500 signals in a year and we achieved a profit factor of 3.55 and a SQN (System Quality Number) of 5.7.
The success rate was of 89.5%, which is very high.
The results of the system can be considered as exceptional.
I now have more than 10 years in my career as a trader. I developed more than 100 of indicators and robots. This system is the very best I have ever seen in my career.
I want to be as transparent as possible regarding the results of this strategy. I give you below detailed results for all assets used in the basket for the years 2017, 2018, 2019, 2020.
You can also find screenshots of the back test for the individual stocks that are part of the basket. Just click the simul link to view the screenshot.
AAPL: 26 trades - 80.8% - simul
ACN: 37 trades - 81.1% - simul
ADBE: 31 trades - 87.1% - simul
ADI: 24 trades - 70.8% - simul
ADSK: 32 trades - 71.9% - simul
ALGN: 27 trades - 66.7% - simul
AMAT: 19 trades - 94.7% - simul
AMBA: 19 trades - 78.9% - simul
ANET: 17 trades - 64.7% - simul
APO: 23 trades - 73.9% - simul
BLK: 24 trades - 75.0% - simul
BURL: 23 trades - 60.9% - simul
C: 19 trades - 78.9% - simul
CAH: 18 trades - 72.2% - simul
CL: 21 trades - 60.0% - simul
CME: 28 trades - 63.0% - simul
CMG: 18 trades - 77.8% - simul
COP: 24 trades - 70.8% - simul
CRM: 21 trades - 66.7% - simul
DD: 5 trades - 80% - simul
DFS: 26 trades - 65.4% - simul
DG: 34 trades - 64.7% - simul
ETN: 25 trades - 68.0% - simul
EXPE: 17 trades - 58.8% - simul
FDX: 17 trades - 70.6% - simul
GD: 22 trades - 63.6% - simul
GPC: 26 trades - 73.1% - simul
HES: 22 trades - 77.3% - simul
HSY: 24 trades - 75.0% - simul
ICPT: 23 trades - 65.2% - simul
ISRG: 24 trades - 66.7% - simul
ITW: 19 trades - 63.2% - simul
JPM: 21 trades - 81.0% - simul
KLAC: 25 trades - 68.0% - simul
KMB: 15 trades - 71.4% - simul
LVS: 19 trades - 77.8% - simul
MA: 30 trades - 76.7% - simul
MAR: 26 trades - 76.9% - simul
MCK: 22 trades - 57.1% - simul
MS: 17 trades - 64.7% - simul
MSFT: 20 trades - 75.0% - simul
MU: 19 trades - 68.4% - simul
NFLX: 24 trades - 75.0% - simul
NVDA: 21 trades - 81.0% - simul
OKE: 22 trades - 72.7% - simul
OLED: 23 trades - 73.9% - simul
PZZA: 17 trades - 58.8% - simul
RH: 23 trades - 65.2% - simul
SBUX: 20 trades - 70.0% - simul
SPLK: 25 trades - 62.5% - simul
STMP: 27 trades - 81.5% - simul
STX: 25 tardes - 68.0% - simul
TSCO: 26 trades - 64.0% - simul
TXN: 14 trades - 85.7% - simul
V: 29 trades - 75.9% - simul
VMW: 20 trades - 65.0% - simul
WDC: 15 trades - 53.3% - simul
WYNN: 21 trades - 65.0% - simul
ZTS: 19 trades - 68.4% - simul
Indicators and Expert Advisors (EA) for SQN MAX strategy are available in MQL5 platform:
-SQN MAX indicator for MT4: https://www.mql5.com/en/market/product/48713
-SQN MAX indicator for MT5: https://www.mql5.com/en/market/product/48870
-SQN MAX Expert Advisor for MT4: https://www.mql5.com/en/market/product/50055
-SQN MAX Expert Advisor for MT5: https://www.mql5.com/en/market/product/50057
You can get an overview of all the indicators I developed for Metatrader: overview
We also developed indicators that work with NinjaTrader 8 professional free trading platform: overview
Questions and Answers
What is the origin of the SQN MAX strategy?
In my journey as an apprentice trader, I had the opportunity to meet some traders that are millionaires. They all started with small capital, failed, tried again and finally got success after a breakthrough in their carrer as a trader.
In 2019, I met a trader called Simon. He trades based on the work of John Carter about market timing. Simon is very successful. After years of failure he finally became a millionaire.
I tried to follow the trades of Simon and replicate them into my account, but it was very difficult.
Since I was not able to profit from the trades of Simon, I decided to analyze the work of John Carter and take advantage of it to build my own trading system.
I wanted to build a system that was simple, that was robust, that could be automated, that was easy to follow (like a set and forget approach, with little to no management of the trades).
The first results I achieved with these few concepts were amazing. Results were so good that I thought that there might have been an error in the coding of the strategy.
I produced more than hundreds of back tests, with different settings, different time periods and 99% of the time the results were good or very good.
At this time I understood that I had a very good strategy in my hands, and I decided to call it the SQN MAX strategy.
I must admit that in my carrer as a trader, since 2012, I had never seen a strategy performing so well.
What is the SQN MAX strategy based on?
The strategy was designed with few simple concepts like:
-Market timing,
-Volatility,
-Trend.
I consider that complicated strategies only work with a lot of optimization and do not produce stable results over time.
Therefore I did all my best to keep the strategy as simple as possible.
Is the SQN MAX strategy risky?
No, the strategy does not use any of the following:
-Grid strategy,
-Martingale strategy,
-Hedging strategy.
The strategy is only based on good entries, with stop loss to protect capital and reduce the risk. We do not use any technique that could result in high risk situation.
Therefore I did all my best to keep the strategy as simple as possible.
What financial instruments should I trade?
You can trade any instrument. There is no limitation related to the EAs but we had best results with American stocks listed above. Of course you can experiment by yourself and find other instruments. Some beta testers had good results trading indices like DAX, SP500, DOW, etc..
What time frame should I trade?
The strategy is working fine with the H1 time frame. If you reduce the time frame then you will have more signals but you will also reduce the accuracy of the signals. Therefore, we recommend users to stay with the H1 time frame. According to our experience, this is the best time frame to produce good results.
How accurate is the strategy?
The strategy can produce results with accuracy of 70% to 90%. This is quite high accuracy. But to produce such results you have to select properly the instruments you trade. We recommend you to use the list we published above.
What is the profit factor of the strategy?
Depending on the settings used we were able to achieve values ranging from 2.0 to 14.0.
Average values for the profit factor range from 2.5 to 3.5
What is the SQN number of the strategy?
SQN stands for System Quality Number. This system was introduced by famous trader Van Tharp and the goal of this system is to evaluate objectively the quality of a trading systems.
You can find more at Quantsahre.com about Van Tharp Sqn Concept
According to Van Tharp, standard interpretation of SQN score is as follows:
-Score: 1.6 - 1.9 Below average, but trade-able
-Score: 2.0 - 2.4 Average
-Score: 2.5 - 2.9 Good
-Score: 3.0 - 5.0 Excellent
-Score: 5.1 - 6.9 Superb
-Score: 7.0 – Keep this up, and you may have the Holy Grail.
With the SQN MAX strategy, we achieved SQN number as high as 5.0, which is a very exceptional result.
What is the annual profit gain?
If you follow our recommendations and use a basket of instruments then you can achieve 80% to 200% yearly profit gain depending on the settings used for the strategy.
What is the maximal draw down?
In our experiments we achieved small draw downs of less than 10% over a year. This is historical draw down, it does not mean that we will have the same results in the future.
What is the maximal floating percent?
For each position we use a Stop Loss and a Time Stop (optional) to control risk. This way we can reduce significantly the floating for the strategy tradinq a basket of financial instruments. In our experiments we achieved a floating of less than 10% over a year. This is historical value, it does not mean that we will have the same results in the future.
How long do the trades last?
Trades can last a few hours to a few days (up to 2 weeks). Usually trades are closed within 2 to 5 days.
Is the strategy easy to trade?
We designed a strategy that is very easy to follow. This is a set and forget strategy. When you have the entry signal, the trade is placed with a stop loss and take profit and there is no further management of the trade. You just have to wait until take profit or stop loss is achieved.
You can also use a time stop to close trades where price does not move quickly in the expected directon. We recommend a time stop of 30 to 70 bars. If you trade the H1 time frame then it means 30 to 70 trading hours.
How many trades will the strategy produce?
If you trade the H1 time frame then the system will produce few trades, 7 to 15 trades per year. Means more or less a trade per month. It might not be enough to produce high profits with this trading system. We encourage you to trade a basket of instruments. For instance you can decide to trade all stocks that we listed above. With a basket of 60 instruments we were able to produce 600 trades in a year, that means 1 to 3 trades per day.
What are the recommended settings for the EAs?
You can use following settings for the EAs:
-TradeDirection=LongOnly
-TakeProfitATR=3.0 (values from 3.0 to 6.0)
-StopLossATR=6.0 (values from 3.0 to 6.0)
-UseTimeStop=false (optional)
-TimeStopBars=70 (values from 30 to 70)
Of course you can try any other setting of your choice, but we found that those settings produce good results over time.
Can I trade options with this strategy?
The strategy was first designed to trade options. The strategy will even work better with options. You can trade PUT and CALL options, or you can use spreads.
For those who don't want to trade options then you can trade the stock market (BUY TO OPEN orders), or trade CFDs (BUY and SELL orders).
What brokers can I trade with the EAs?
The EA is supposed to work with any Metatrader 4 and Metatrader 5 broker, depending on the version of your EA (MT4 or MT5).
If you want to trade stocks with CFDs then you should search for brokers that offer CFDs (and not only Forex).
-AdmiralMarkets: widest choice of CFDs (more than 2000) available with MT5 platform,
-Pepperstone: offer major stocks as CFDs (more or less 100) available with MT5 platform,
-ICMarkets: offer major stocks as CFDs (more or less 80) available with MT4 platform,
-Osprey: offer major stocks as CFDs (more or less 30) available with MT4 platform (accept US Citizens).
If you want to trade options then there are many brokers that offer these instruments for the American stock market:
-TD Ameritrade
-Tastyworks
-Robinhood
-And others
Of course there are many more brokers in the market. If you find some that work fine for you then you can contact me in private and I might add it to the list of brokers.
Can I back test the strategy with the EAs?
Yes you can back test the strategy with the EAs. You even can do it before buying the EA. MQL5 allows users to freely test indicators and EAs with the Strategy Tester.
Be aware that if you don't follow our recommendations you will not have good and reliable results from the back testing.
According to our experience, most brokers don't provide correct historical data for American stocks and CFDs. The only broker I found with reliable data is AdmiralMarkets.
You must test with Every Tick model of Metatrader and you must check that the Ticks History Quality provided by your broker is more than 99%. If you don't have 99% and more for the Ticks History Quality then the results produced by the back test are not valid.
Before running a back test check all inputs of the EA. Each input is important and can significantly change the end result:
-TradeDirection
-TakeProfitATR
-StopLossATR
-UseTimeStop
-TimeStopBars